What 50 Days of Consistency Looks Like in Data: A Performance Analytics Case Study (Power BI & R)
This case study explores a 50-day self-tracked bodyweight training challenge and demonstrates how personal performance data can be transformed into a structured analytical project using Power BI and R.
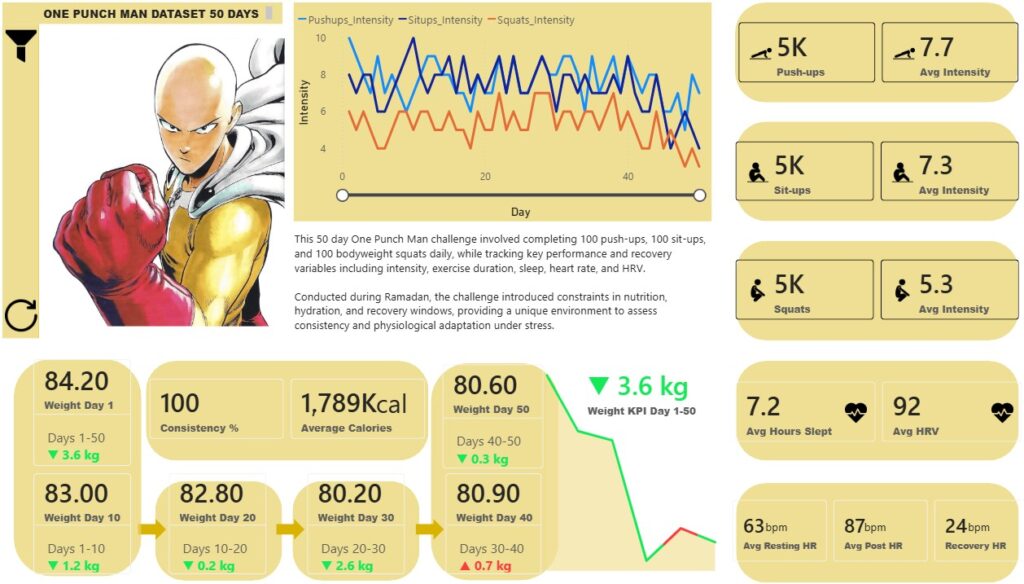
The challenge consisted of completing 100 push-ups, 100 sit-ups, and 100 bodyweight squats daily. Rather than treating this as a simple fitness task, the project was designed to capture multiple performance and recovery variables in order to assess how consistency, recovery, and physiological response evolved over time.
The broader objective was to investigate whether a simple but consistent training protocol, performed under constrained conditions during Ramadan, could produce measurable outcomes while also serving as a credible data analytics case study.
Dataset and Approach
The dataset consists of 50 daily observations, with each entry representing a single training session. A range of variables were recorded to capture both performance output and recovery status, including:
- Bodyweight (kg)
- Exercise intensity (1–10 scale)
- Session duration (minutes)
- Sleep duration (hours)
- Resting and post-workout heart rate
- Heart rate variability (HRV)
- Estimated calorie intake
This multi-variable structure allowed the analysis to extend beyond simple repetition tracking into a broader performance analytics framework.
Data preparation involved cleaning inconsistencies, standardising units, and structuring the dataset for analysis within Power BI. DAX measures were created to generate key metrics such as average values, recovery indicators, and weight progression checkpoints.
Dashboard Design
The Power BI dashboard was designed to balance clarity and analytical depth. The layout was structured around three core components:
- Performance Output
KPI cards summarising total repetitions and average intensity across exercises. - Recovery Indicators
Metrics including sleep duration, HRV, resting heart rate, and post-workout heart rate to provide insight into physiological response. - Progression Analysis
A combination of checkpoint weight metrics and a sparkline-style trend to visualise bodyweight changes across the 50-day period.
Time-series visualisation was used to track intensity patterns across push-ups, sit-ups, and squats, allowing comparison of effort levels over time. Slicers were incorporated to enable filtering by intensity bands, sleep duration, and training duration, transforming the dashboard into an interactive analytical tool.
Results
The analysis showed that the challenge was completed with 100% adherence across all 50 days. This level of consistency formed the foundation for all observed outcomes.
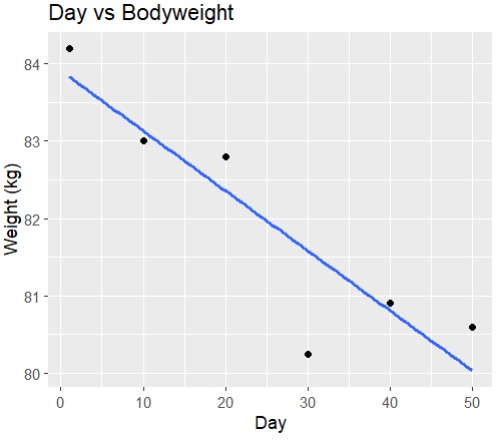
Bodyweight decreased from 84.2 kg on Day 1 to 80.6 kg on Day 50, representing a net reduction of 3.6 kg. The progression was not linear, with a temporary increase observed around Day 40 before returning to a downward trend. This highlights the importance of analysing trends rather than relying on single end-point values.
Recovery metrics provided additional context. Average sleep duration was approximately 7.2 hours, while HRV averaged around 92. Variability in these metrics aligned with fluctuations in training intensity, suggesting that performance was influenced by recovery quality rather than consistency alone.
Extended Analysis Using R
To strengthen the analysis, statistical methods were applied using R.
A strong negative correlation was identified between time and bodyweight (r = -0.898), with an R² value of 0.807. This indicates that approximately 80.7% of the variation in bodyweight can be explained by progression through the training period, providing strong evidence of a consistent downward trend.
Additional analysis showed:
- A weak relationship between calorie intake and training output
- No meaningful relationship between session duration and intensity
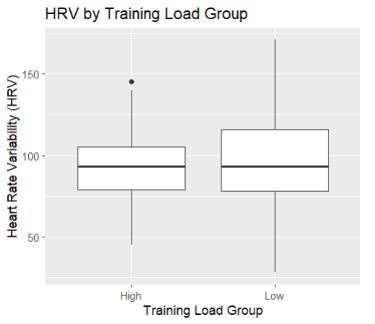
- No statistically significant difference in HRV between high and low training load groups (p = 0.754)
These findings suggest that longer sessions or higher calorie intake did not directly translate to improved performance. Instead, consistency and recovery appeared to play a more important role.
Limitations
Several limitations should be considered when interpreting the results.
The dataset is based on a single participant, meaning findings are not generalisable beyond a case study context. Calorie intake values were estimated rather than precisely measured, reducing their reliability as an exact metric.
Weight measurements were recorded at checkpoints rather than daily, limiting the resolution of time-series analysis. Additionally, body fat percentage was excluded due to inconsistent measurement.
The original challenge concept includes a daily 10 km run, which was intentionally excluded. This decision was made to reduce the risk of overuse injury and excessive fatigue, particularly given the high-frequency training and recovery constraints. Existing research highlights that rapid increases in training load and inadequate recovery significantly increase injury risk.
Conclusion
This project demonstrates how a structured approach to personal data collection can be used to produce meaningful analytical insight.
The findings show that consistent training, even under constrained conditions, can lead to measurable improvements in bodyweight and performance. More importantly, the project highlights the role of recovery variables in influencing performance variability.
From a data analytics perspective, the project showcases the application of data cleaning, modelling, DAX measure creation, dashboard design, and statistical analysis within a real-world context. By combining Power BI with R, the analysis moves beyond descriptive reporting into a more robust analytical framework.
As a portfolio piece, this case study demonstrates the ability to apply analytical thinking to self-collected data and communicate insights effectively through both visualisation and statistical interpretation.
Full Report
The full technical report, including DAX measures and R analysis, is available here: